
📈 Plot Twist Punchlines
That graph had a twist ending—it really took a turn!
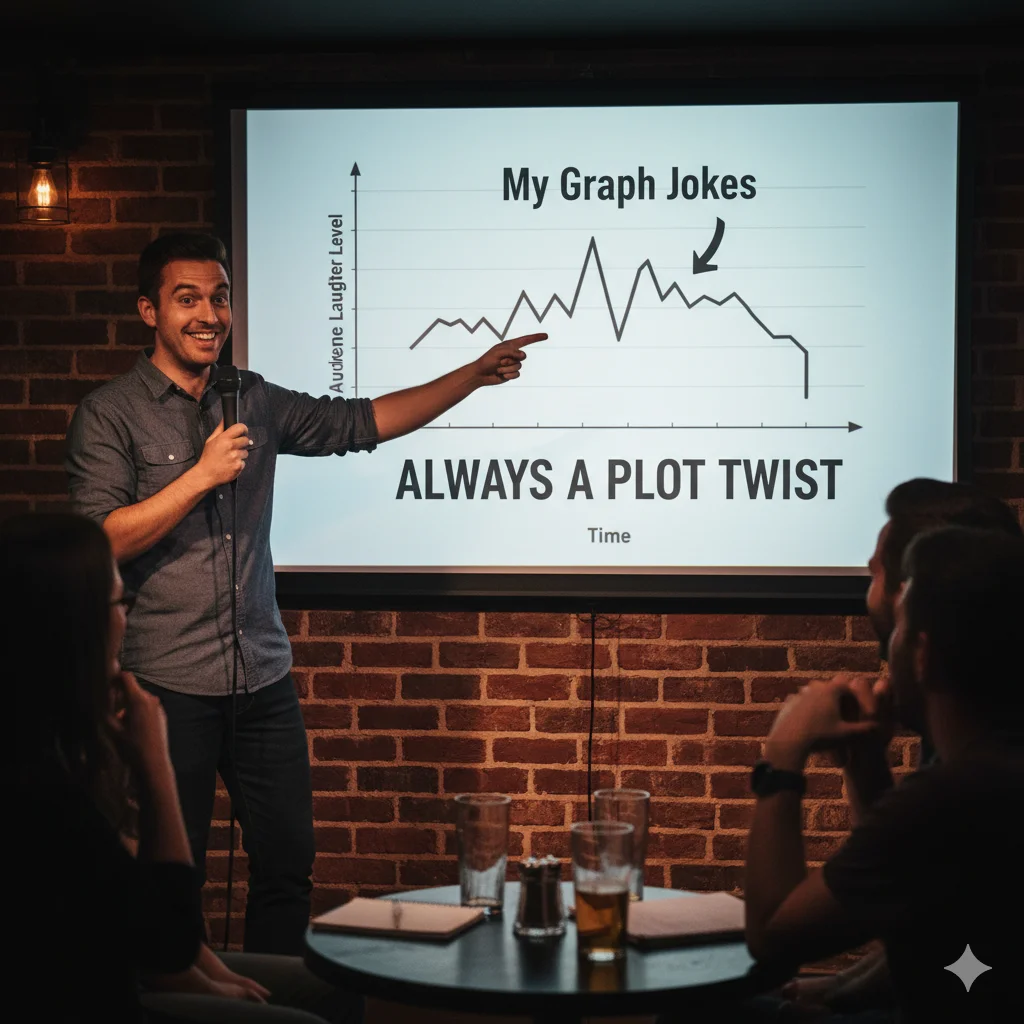
My favorite drama? A well-labeled plot.
Don’t trust graph villains—they’re always plotting.
That line graph? Full of ups and downs—just like my emotions.
The plot thickens… with data!
I drew a graph of my laziness. It was a flat line.
My graph broke up with me—it said we lost our connection.
Plotting revenge? Try plotting data first.
The twist? It was all nonlinear!
📊 Excel-lent Humor
I Excel at spreadsheets—pun intended.
Conditional formatting? More like unconditional fun!
My formulas are solid—just like my punchlines.
I pivot on tables and on jokes!
Ctrl + Alt + LOL!
Don’t chart me—I’m sensitive!
Spreadsheet jokes are formulaic.
That’s one cell-fish joke!
I tried to Excel socially… didn’t work.
Data validation? More like data vacation!
🧮 Axis of Evil Laughs
That Y-axis is always trying to rise above.
X-axis walked out—it couldn’t handle the pressure.
I’m drawn to you like a curve to an axis.
The axis was feeling cross.
Stay aligned or you’ll skew the vibe.
My ex-axis left me for a histogram.
Keep your variables in line—or they’ll go rogue.
Axis jokes: they never intersect with reality.
I’m stuck in a graph—it’s axis-ting!
Don’t be mean—stay centered on the axis.
🥧 Pie Chart Puns
I ate the pie chart—whoops, data loss!
I only trust pie charts. They’re well-rounded.
That chart was deliciously informative.
Life’s better when it’s divided evenly… like a pie chart.
This data is flaky—like a crust.
My love for pie charts? 100%!
You complete my circle graph.
Slices of data, served with sarcasm.
Don’t dessert your statistics.
It’s all about that filling… and filtering.
📐 Line Graph Laughs
My interest in graphs is trending up.
We have great chemistry—look at our correlation!
My social life? It’s a dotted line.
I’m not straight—neither is my trend line.
Slopes are slippery—watch out!
This graph has more drama than a soap opera.
Upward trends = mood booster.
Flat lines = no pulse.
Graph me like one of your French spreadsheets.
Smooth curves are attractive—statistically.
📊 Scatterbrained Jokes
I’m scatterbrained—like an unorganized scatter plot.
No correlation? No problem!
I fell in love with a scatter plot—it was all over the place.
Chaos? Just another dataset!
This plot has no direction—just vibes.
Outliers welcome here!
I tried fitting in—got labeled an outlier.
Just a dot looking for a pattern.
Clustered emotions, plotted feelings.
You can’t plot love—it’s random.
📉 Downward Spiral Gags
My mood? Like a graph trending down.
Revenue fell—and so did my hopes.
Just a stat in a sad chart.
The only thing declining faster is my patience.
This trend is falling—better get a parachute!
Even the graph gave up halfway.
Drop it like it’s statistically significant.
My GPA is a great line… going down.
It’s not failing—it’s just descending potential.
Freefall Friday!
🔍 Funny Forecasts
According to my data, you owe me coffee.
Weather graphs always cloud my judgment.
High pressure? Just a peak on the graph.
90% chance of sarcasm today.
Let’s analyze this forecast with feelings.
This trend is snowballing!
Sun? Graph says otherwise.
The forecast: scattered humor.
Expect spikes in laughter.
I chart storms emotionally and statistically.
📈 Correlation Nation
We had chemistry—but no correlation.
Statistically speaking, I miss you.
Correlation is not causation—just like liking doesn’t mean love!
The only thing I’m correlated with is chaos.
Positively in love with your data.
That’s a strong relationship… on the graph!
We go together like trend lines and bias.
My confidence interval just dropped.
I’m statistically attracted to you.
Let’s model this relationship!
🔢 Data Dating
He ghosted me… even in the dataset.
Our love didn’t make the final graph.
My dating life is like a broken chart—full of missing values.
We didn’t align—axis issues.
Swipe left on that outlier!
Error 404: date not found.
Love at first data point!
My heart is a dataset—messy but meaningful.
We were an average match.
Still searching for statistical significance in love.
🧠 Nerdy Numbers
π charts? More like pie-in-the-sky dreams.
Square roots are my safe space.
Geometry’s fine—but graphs are sexier!
Plotting revenge—mathematically.
Logarithms never lie.
Love = ∫ from 0 to forever.
Number nerds do it with precision.
Calculating charm at exponential rates.
This joke is sine-fully funny.
I derive pleasure from data.
🧾 Report Card Gags
Straight A’s? More like straight lines!
My report looks like a downward slope.
Teacher said “analyze the graph”—I overanalyzed my life.
This curve needs curving!
Trend: failing upward.
The only peak was anxiety.
My grades? A mystery dataset.
I extrapolated myself out of school.
This report card belongs in the recycling bin.
Zero standard deviation = zero drama.
🧰 Tool Time Puns
My favorite tool? The graphing calculator.
Graph tools: because crayons don’t cut it.
Love is a messy line on a clean chart.
Just call me a chart whisperer.
Toolbars and tissues—data can be emotional.
I draw lines, not conclusions.
Legends never die—unless hidden in the graph.
My ruler rules!
Charting ahead with graph gear!
Never underestimate a nerd with a compass.
🎓 Classroom Crack-Ups
Teacher: “Plot it!” Me: “Plot what?”
This graph needs tutoring.
Got lost between the axes.
Math class = emotional rollercoaster.
Homework: Graph your feelings.
Pop quiz? More like pop chart!
This test was off the grid.
Can I graph my stress level?
A+ for attitude, F for axis.
Just here to draw smiley faces in the margins.
🧊 Cool Calculations
This graph is chill—ice cold data.
Freeze the frame—capture that chart!
Arctic data vibes only.
Cool curves, hotter puns.
Just a cold hard line of facts.
Frosty with a chance of outliers.
Slippery slopes are cool graphs.
Ice graphs, baby!
Graph freeze: system overload.
Statistically cool!
🔥 Hot Takes on Graphs
These trends are fire!
Graphs don’t lie—just roast.
Chart me like one of your hot takes.
That graph went viral—and so did I!
Scorching stats!
Steamy scatter plots.
This chart’s bringing the heat.
Flame emojis all over that bar!
That graph just roasted my assumptions.
Burn, baby, burn… data inferno.
🤖 AI & Analytics Antics
My robot plotted a love story.
AI can draw graphs—but can it love?
Predictive models didn’t see this punchline coming.
Sentiment analysis: 100% punny.
I trained a model on dad jokes—it peaked here.
Data science? More like data sass!
Even algorithms LOL’d at this.
GraphGPT, anyone?
Forecast: 90% chance of funny.
Machine learning, human giggles.
🧙 Fantasy Graphs
This graph is pure wizardry.
Dragons love exponential curves.
My line chart just cast a trend spell.
The chosen plot!
Statistical sorcery!
Dungeons & Data Sheets.
Plot armor? Try plot axes!
Elf-approved analytics.
Once upon a chart…
Enchanting errors!
🧁 Sweet Stat Treats
This pie chart is too sweet.
Sugar levels are off the charts.
Sprinkle in some stats.
Cupcake curves, donut data.
Graphs baked to perfection.
Deliciously descriptive data.
Topped with trend lines.
Bar graphs? More like candy bars!
Eye candy charts.
Dessert first—then plotting.
🛸 Out-of-This-World Graphs
Beam me up, statsy!
Alien data is… out of this world!
Graphing galaxies now.
The stats are not from Earth!
Interstellar scatter plots.
This graph has space issues.
ET phoned in a trend.
Planetary projections!
The Y-axis is in another dimension.
Launching charts into orbit!